
Dow Jones Industrial Average Drops the Most Since 2009
On Friday, February 2, 2018, there was an outright bloodbath on the key stock indices. Indices like the Dow Jones Industrial Average dropped 665 points, or 2.54%, from the previous day. This was the biggest one-day decline since the Lehman Brothers Holdings Inc. bankruptcy.
Looking at this, investors may be asking, what is next for the Dow Jones Industrial Average and other key stock indices?
Advertisement

While there’s a lot of noise and speculation on where stocks could go next, there are three things that investors need to be watching closely.
Pay Attention to the Long-Term Trend
First and foremost, it’s important to keep the big picture in mind. For this, look at the long-term chart of the Dow Jones Industrial Average.
The long-term uptrend on the Dow Jones hasn’t been broken yet. It could come down to the 22,000 level and it will still remain in the uptrend that began in 2016.
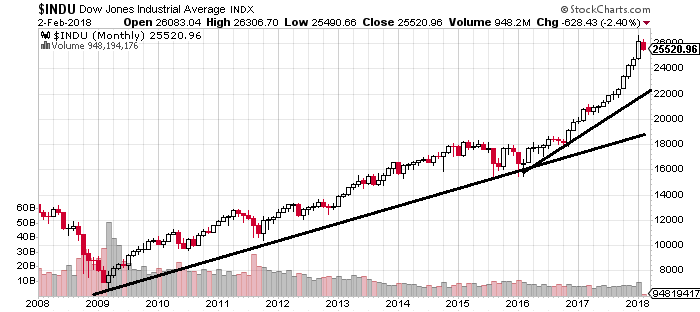
Chart courtesy of StockCharts.com
If the 22,000 level breaks, the index could drop to as low as around 19,000 and the long-term trend that began in 2009 would remain in play.
Let’s do some simple math. If the Dow Jones Industrial Average drops to 22,000, it would mean a decline of close to 14%.
If the index drops to 19,000, it would mean a decline of over 25%.
Investor Psychology Could Make the Sell-Off Bigger
The second thing to keep in mind is investor psychology.
Investors, at times, tend to panic and sell. They don’t really need a reason for it. But if they see an asset value decline, they sell to take profits off the table or cut their losses.
The move we saw on the Dow Jones Industrial Average was a sizable one. It’s something that investors who bought in 2017 have not seen. Don’t be shocked if they start questioning future returns and sell their stocks.
Bond Market Worth a Close Watch
Third, it’s important to pay close attention to the bond market.
One of the biggest reasons the Dow Jones and others dropped was panic in the bond market.
Look at the long-term chart of the yields of the 10-Year U.S. Treasury below. Pay close attention to the line drawn. Keep one thing in mind; when yields are rising, it means bond prices are declining.
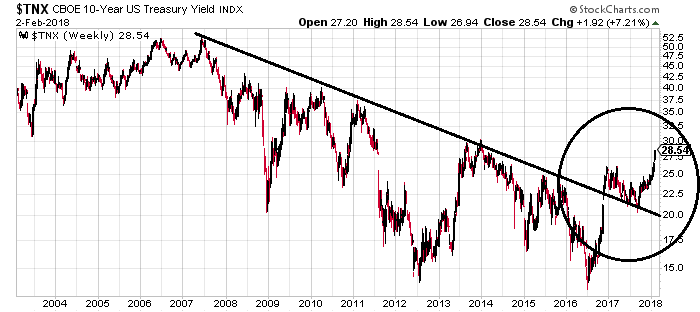
Chart courtesy of StockCharts.com
Notice the trend breaking to the upside? Saying the least, this is very bad news for bond investors. The yield chart is saying that bond prices could decline much more. So, there could be a lot of volatility in the bond market and this could spill over into stocks.
Stock Market Outlook: Stock Investors Beware
Dear reader, if you follow Lombardi Letter closely, you have been warned several times about this.
What happened on Friday could be an indicator of a formation of a short-term top on key stock indices like the Dow Jones Industrial Average. We could see the sell-off prevail.
Remember, it’s been a great run on the markets since 2009. At this point, with the U.S. economy starting to show cracks, the U.S. dollar tumbling, and the bond market witnessing headwinds, investors could also be thinking about raising some cash for their portfolios. In the midst of this, we could get a big sell-off.